
Greatist News examines and explains the trends and studies making headlines in fitness, health, and happiness. Check out all the news here.
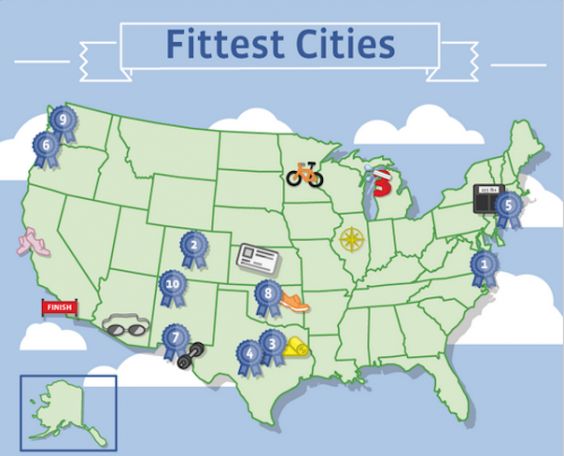
Photo: FacebookStories.com
Last week, social media behemoth and FOMO contributor Facebook released an infographic listing America’s fittest cities according to user data. Virginia Beach, Virginia, took the top spot for fitness-friendly locales, followed by Colorado Springs, Colorado, and Austin, Texas. Even more interesting than the data itself, however, was how Facebook’s rankings differed from the American College of Sports Medicine’s (ACSM) American Fitness Index “Fittest Cities” list for 2013.
Only one city — perennially fit Portland, Oregon — cracked the top 10 on both lists, and Facebook’s eighth-place Oklahoma City, Oklahoma, came it at 50 on the ACSM list. Why did the lists differ so dramatically, and what does their variance say about how we collect and use fitness data?
Why It Matters
To compile their report, Facebook analyzed data from January 1st to March 1st of 2013 for U.S. cities that had at least 200,000 Facebook users. The social network’s infographic illustrated the top 10 list, which was based on fitness-related check-ins, mentions, and use of Facebook apps. It also included the top cities for specific fitness activities, such as dance (Oakland, California) and CrossFit (El Paso, Texas). The full top 10 follows:
- Virginia Beach, VA
- Colorado Springs, CO
- Austin, TX
- San Antonio, TX
- Livingston, NJ
- Portland, OR
- El Paso, TX
- Oklahoma City, OK
- Tacoma, WA
- Albuquerque, NM
It’s important to remember that Facebook’s info here is both internal and far from scientific. We don’t know too many specifics (like, say, the number of Tucson residents who checked into spin class every week), but the graphic does give some idea into how — and where — people are sharing their fitness activities across the U.S.
While Facebook’s fitness infographic is based entirely on self-reported user data, the ACSM’s annual list relies on a compilation of a year’s worth of surveys, disease prevalence statistics, census info, and environmental and community indicators. The ACSM index provides significant insight on things like parks department expenditures, obesity trends, and the number of baseball diamonds per capita. While it does include some self-reported data sets from residents like the percentage of smokers in a given city, it doesn’t necessarily tell us if or how they’re using available fitness resources effectively.
Is It Legit?
Probably. Beyond profile pics and birthday notifications, Facebook is trying to position itself as a fitness destination for the tracking-minded. The infographic post on Facebook Stories includes a callout to Facebook’s new Get Fit Guide, and the company has recently made it easy to share live events like “Lost weight” and “Started running.” So while Facebook’s data here isn’t necessarily thorough, it is a potentially better depiction of “popular” health where people care about checking in.
But it’s impossible to say one ranking is inherently more valuable than the other. After all, one list looks at activities people report on their social networks, while the other concentrates more on the resources available to various populations. Also, some cities might simply have more share-happy residents than others, regardless of their exercise habits (this could be especially impactful in cities with younger populations).
Comparing the points of overlap could prove valuable when evaluating the two lists, especially when they show whether (or not) residents are taking advantage of what’s available to them. According to Facebook, Minneapolis is America’s best biking city, and its residents were also commended by the ACSM for being more likely to pedal to work. San Diego got Facebook’s nod as the nation’s top marathon city, and it also beat the national average for money spent on parks and acres of parkland as reported by the ACSM. Of course, it’s difficult to say whether these connections are coincidental or more deeply linked.
The Takeaway
Regardless of how the different lists stack up, with more and more people heading online to track their health and fitness, social data is an increasingly powerful tool to identify trends in wellness. This information could prove to be extremely valuable for civic planners and governments looking to figure out how their constituents are getting active (and even what they like to do). And that could translate into money better spent on projects that will have the greatest impact on fitness in cities across the country.
Do you think data from social networks should influence how cities spend money on fitness? Let us know in the comments below and tweet the author @d_tao.